In 2011, the economist Tyler Cowen published The Great Stagnation, a short treatise with a provocative hypothesis. Cowen challenged his audience to look beyond the gleam of the internet and personal computing, arguing that these innovations masked a more troubling reality. Cowen contended that, since the 1970s, there has been a marked stagnation in critical economic indicators: median family income, total factor productivity growth, and average annual GDP growth have all plateaued. Cowen articulated the disconnect between technological innovation and real economic advancement with compelling clarity:
Today [in 2011] . . . apart from the seemingly magical internet, life in broad material terms isn’t so different from what it was in 1953. We still drive cars, use refrigerators, and turn on the light switch, even if dimmers are more common these days. The wonders portrayed in The Jetsons . . . have not come to pass. You don’t have a jet pack. You won’t live forever or visit a Mars colony. Life is better and we have more stuff, but the pace of change has slowed down compared to what people saw two or three generations ago.
Cowen went on to point out that while people have gotten used to incremental improvements in most technologies, technological leaps used to be far more significant:
You can argue the numbers, but again, just look around. I’m forty‑five years old, and the basic material accoutrements of my life (again, the internet aside) haven’t changed much since I was a kid. My grandmother, who was born at the beginning of the twentieth century, could not say the same.
In the years since the publication of the Great Stagnation hypothesis, others have stepped forward to offer support for this theory.1 Robert Gordon’s 2017 The Rise and Fall of American Growth chronicles in engrossing detail the beginnings of the Second Industrial Revolution in the United States, starting around 1870, the acceleration of growth spanning the 1920–70 period, and then a general slowdown and stagnation since about 1970.2 Gordon’s key finding is that, while the growth rate of average total factor productivity from 1920 to 1970 was 1.9 percent, it was just 0.6 percent from 1970 to 2014, where 1970 represents a secular trend break for reasons still not entirely understood. Cowen’s and Gordon’s insights have since been further corroborated by numerous research papers. Research productivity across a variety of measures (researchers per paper, R&D spending needed to maintain existing growth rates, etc.) has been on the decline across the developed world.3 Languishing productivity growth extends beyond research-intensive industries. In sectors such as construction, the value added per worker was 40 percent lower in 2020 than it was in 1970.4 The trend is mirrored in firm productivity growth, where a small number of superstar firms see exceptionally strong growth and the rest of the distribution increasingly lags behind.5
A 2020 article by Nicholas Bloom and three coauthors in the American Economic Review cut right to the chase by asking, “Are Ideas Getting Harder to Find?,” and answered its own question in the affirmative.6 Depending on the data source, the authors find that while the number of researchers has grown sharply, output per researcher has declined sharply, leading aggregate research productivity to decline by 5 percent per year.
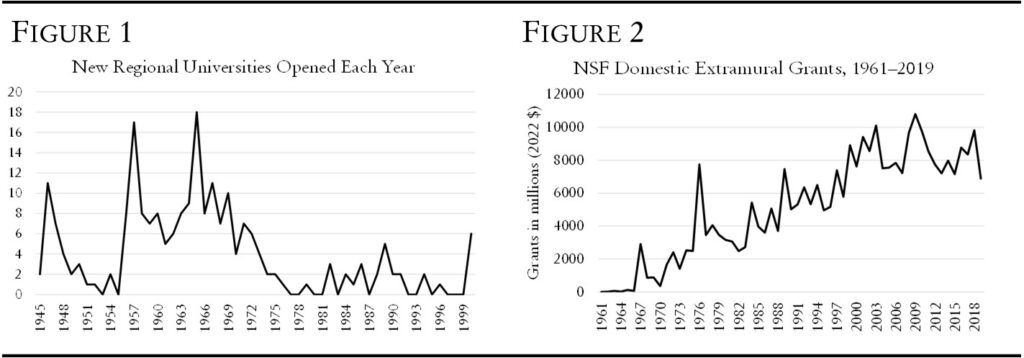
This stagnation should elicit greater surprise and concern because it persists despite advanced economies adhering to the established economics prescription intended to boost growth and innovation rates: (1) promote mass higher education, (2) identify particularly bright young people via standardized testing and direct them to research‑intensive universities, and (3) pipe basic research grants through the university system to foster locally-driven research and development networks that supercharge productivity.7 Figures 1 and 2 illustrate, respectively, the massive post–World War II expansion of regional universities aimed at democratizing higher education, and the growth in National Science Foundation (NSF) domestic extramural research grants from 1962 to 2019 in 2022 dollars. Concurrently, many elite institutions became more meritocratic, chiefly by incorporating standardized test scores into their admissions decisions. These pro-growth reforms were intended to help the Cold War–era United States develop scientific talent, but they were also essential preconditions for the formation of America’s vaunted tech clusters—Silicon Valley, Boston/Cambridge, Seattle, New York, Los Angeles, and increasingly Austin—which are all world-leading centers for science, entrepreneurship, and innovation. These clusters excel at attracting college-educated talent and securing billions in basic research grants from public and private foundations. These tech clusters are also disproportionately responsible for America’s technological innovation,8 which has been perhaps the most important contributor to growth since the start of the Industrial Revolution.9 And yet, in spite of all of those pro-innovation changes, the United States finds itself facing persistently slow growth.
Why hasn’t the extensive expansion of higher education, the investment of billions in basic research, the dominance of American research universities, and the ultimate emergence of highly productive clusters done more to counter any headwinds to growth? Tyler Cowen himself argues that the growth slowdown was inevitable, a consequence of all of the “low-hanging” technological fruit being plucked during the late nineteenth and early twentieth centuries. What remains demands greater effort to discover, exploit, and commercialize. As Robert Gordon points out, revolutionary technologies like electrification, antibiotics, and the mechanized motor can only be invented and mass distributed once. Other explanations include the post-1970s rise in legal barriers to housing growth that impede the ability of people to move and spatially sort based on their abilities,10 or the effects of a slowly aging workforce, such as the decline in start-ups (which mostly occur among younger people) and GDP growth.11
While the aforementioned explanations may have merit, it remains an open question why the standard economics growth prescription did not yield stronger productivity and income growth. One possibility is that, in the counterfactual, growth prospects in the United States and other advanced economies would have been even worse had it not been for these state investments in research and education. Perhaps the modest growth of the post-1970 period was the best possible outcome in a landscape where the easier technological innovations had already been exhausted. Another possibility is that these strategies, while potentially the most effective growth-enhancing policies to pursue, inadvertently triggered downstream consequences that contributed to the growth slowdown.12
Under this second possibility, the tech cluster phenomenon stands out because there is a fundamental discrepancy between how the clusters function in practice versus their theoretical contributions to greater growth rates. The emergence of tech clusters has been celebrated by many leading economists because of a range of findings that innovative people become more productive (by various metrics) when they work in the same location as other talented people in the same field.13 In this telling, the essence of innovation can be boiled down to three things: co-location, co-location, co-location. No other urban form seems to facilitate innovation like a cluster of interconnected researchers and firms.
This line of reasoning yields a straightforward syllogism: technology clusters enhance individual innovation and productivity. The local nature of innovation notwithstanding, technologies developed within these clusters can be adopted and enjoyed globally.14 Thus, while not everyone can live in a tech cluster, individuals worldwide benefit from new advances and innovations generated there, and some of the outsized economic gains the clusters produce can then be redistributed to people outside of the clusters to smooth over any lingering inequalities. Therefore, any policy that weakens these tech clusters leads to a diminished rate of innovation and leaves humanity as a whole poorer.15
Yet the fact that the emergence of the tech clusters has also coincided with Cowen’s Great Stagnation raises certain questions. Are there shortcomings in the empirical evidence on the effects of the tech clusters? Does technology really diffuse across the rest of the economy as many economists assume? Do the tech clusters inherently prioritize welfare-enhancing technologies? Is there some role for federal or state action to improve the situation? Clusters are not unique to the postwar period: Detroit famously achieved a large agglomeration economy based on automobiles in the early twentieth century, and several authors have drawn parallels between the ascents of Detroit and Silicon Valley.16 What makes today’s tech clusters distinct from past ones? The fact that the tech clusters have not yielded the same society-enhancing benefits that they once promised should invite further scrutiny.
The Rise of Tech Clusters and Regional Inequality
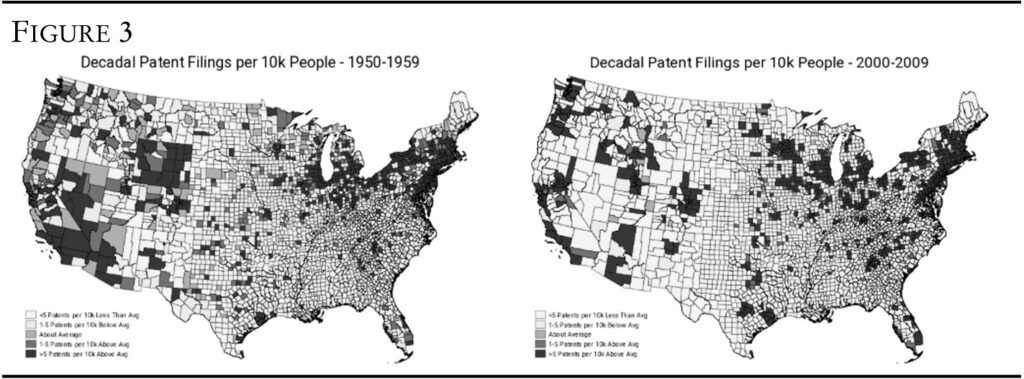
Today, the big tech clusters dominate U.S. patenting activity.17 This was less true in the immediate postwar period. Figure 3 shows decadal patenting rates per 10,000 residents by county compared to the decade’s national average. The graph on the left shows the 1950–59 period. Counties are categorized based on their patenting rate: significantly above the national average (more than 5 per 10,000 persons above), moderately above (1–5 per 10,000 persons above), around the national average (within 1 per 10,000 persons above or below), moderately below, and significantly below the national average (more than 5 per 10,000 persons below). While much of the South has consistently lagged the rest of the country in innovation, many counties in the rural Midwest, rural Interior West, and along the Great Lakes exceeded average patenting rates in the immediate postwar decades. This includes places that are not considered major technology hubs today, such as Duluth (St. Louis County), Minnesota; Cheyenne (Laramie County), Wyoming; and even Las Vegas (Clark County), Nevada. Yet by the 2000s, counties would patent at rates either substantially above the national average or well below. This change was almost completely driven by a surge of patenting rates in the top 1 percent of counties that pulled the mean upwards starting in the 1990s. The median rate rose from about 5 per 10,000 people over the 1950s to about 9 in the 2000s, but the 99th-percentile rate more than tripled from 86 to 273 over this period. Other research has confirmed that this increase in the share of the top 1 percent of patenting locations has driven the post-1945 spatial concentration trend.18
What changed to cause patenting to become more and more concentrated in a relatively small number of counties? The modern-day tech clusters owe their roots both to “natural advantages,” such as long-established research universities, as well as to the intervention of the federal government. Daniel Gross and Bhaven Sampat, in a paper published in the American Economic Review entitled “America, Jump-Started: World War II R&D and the Takeoff of the US Innovation System,” highlight how the U.S. government’s creation of the Office of Scientific Research and Development (OSRD) in 1941 played a key role in the formation of many of today’s tech clusters.19 In the short run, the OSRD helped win the war by marshalling the scientific establishment to focus on critical military needs. In the long run, the OSRD also gave a critical boost to the counties lucky enough to receive substantial wartime contracts. The authors show that OSRD-receiving counties were usually places that had higher than average patenting rates before the war but with patenting trend lines that were evolving in parallel with their peer counties. Yet after a brief period of stagnation in the late 1940s and early 1950s, when war funding dried up, these OSRD counties eventually exhibited “takeoff”—sustained higher patenting rates that compounded over time throughout the 1960s and ’70s. In other words, the OSRD funding boom created a positive trend break even among already inventive counties.
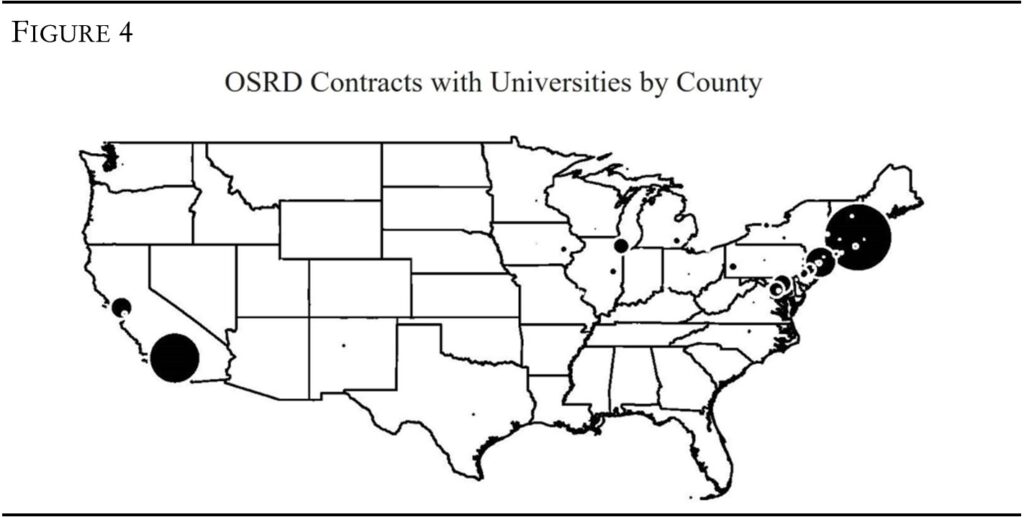
The map in figure 4, drawn from Gross and Sampat’s data, illustrates the distribution of OSRD university funding. Unsurprisingly, the distribution of OSRD funding overlaps substantially with current tech cluster locations, including around Boston, Los Angeles, greater New York, and the Bay Area. Their study makes two further observations about the OSRD’s impact in laying the groundwork for the emergence of today’s tech clusters. First, the post-OSRD success of these regions stemmed largely from the agglomeration effects initiated by the OSRD, rather than subsequent postwar federal military R&D investments. The second is that almost all of the positive effects were concentrated in counties in the top 5 percent of patenting rates during the 1930s. In contrast, counties in the bottom quartile of OSRD treatment saw a relative decline over time, presumably because the OSRD funding boom spurred reallocation of talent and capital away from these counties. This negative effect on the least inventive counties potentially foreshadows the growing disparity in the geography of innovation seen in figure 3.
During the postwar era, national leaders in the United States were focused on maintaining and enhancing America’s technological supremacy over its rivals, while often assuming that the country’s status as the world’s leading manufacturer was secure. As the war was winding down, President Franklin Roosevelt asked Vannevar Bush, the director of the OSRD, to issue a report on what lessons could be drawn from the wartime experience. Roosevelt was particularly interested in expanding the government’s role in funding public interest research and developing effective strategies for identifying and nurturing scientifically talented youth.
Bush’s subsequent report, Science—the Endless Frontier, was eventually presented to President Truman but was faithful in answering Roosevelt’s initial queries.20 While the report is renowned for sketching the outlines of what would become the National Science Foundation (NSF), Bush devoted significant attention to addressing the other challenge posed by Roosevelt: devising methods to discover and train scientifically adept young people.
Bush expressed three key principles that subsequently became the basis for cultivating and funding future scientistic personnel. First, he championed universities as the optimal venues to train future scientists and conduct foundational scientific research. In contrast, Bush viewed government or commercial labs as prioritizing practical applications and commercialization over advancing basic knowledge. Second, Bush expressed concern that postwar America might revert to prioritizing “technical arts” over advancing fundamental scientific knowledge and advocated for a shift in training and funding toward the latter. Third, Bush called for an expansion of mass higher education that would allow the United States to identify and nurture all young people with the potential to excel in science, irrespective of their wealth, stating, “[i]f ability, and not the circumstance of family fortune, is made to determine who shall receive higher education in science, then we shall be assured of constantly improving quality at every level of scientific activity.”
Implicit in Bush’s recommendations were policy reforms that would later play an important role in the emergence of the tech clusters. Bush successfully fought proposals by Senator Harley Kilgore (a Democrat from West Virginia) for an equitable distribution of NSF grants among universities (and thus locations) and guarantees that NSF funding would be allocated to applied as well as basic research.21 As of 2019, 60 percent of the NSF’s domestically awarded grants were awarded to universities that had received OSRD contracts nearly seventy-five years prior. Second, Bush’s emphasis on intellectual ability supported a preexisting social reform movement toward “rationalizing” university admissions on a meritocratic basis. Both aspects of Bush’s vision would have profound implications for America’s subsequent economic development.
Congress duly passed the National Science Foundation Act in 1950, with an initial budget of $230,000 (equivalent to $2.78 million in 2023 dollars) for its first operating fiscal year in 1951. Funding ramped up quickly, and nine years later, by fiscal year 1960, Congress increased the NSF’s budget over fifty-fold to $15.3 million (or $159.3 million in 2023 dollars). Also in line with Bush’s and other postwar leaders’ proposals was a significant expansion in public universities. Most states embarked on ambitious programs to geographically expand their university systems by creating regional or “commuter” universities, under the premise that proximity to a four-year institution would increase the likelihood that young people would pursue higher education.22 As a result, enrollment boomed, with the proportion of students in public, four-year colleges increasing from approximately 50 percent in 1940 to nearly 70 percent in 1970.23 By my count, 189 such universities were established over the thirty-year period spanning 1946–75, not including the creation of new research universities, such as the expansion of the University of California system to include campuses at Irvine (1968), Riverside (1954), San Diego (1960), and Santa Cruz (1965).
Why would the expansion of higher education and an increased emphasis on the liberal arts lead to a more centralized innovation landscape? After all, the high school movement and the surge in workers with high school diplomas in 1910–40 did not lead to the sorting we see today.24 Contrary to the expectation that a growing number of universities across the nation would spread the benefits of additional education across communities, it appears that the postwar expansion of higher education created incentives for college graduates to geographically concentrate, with knock-on effects on innovation and other outcomes. One reason is that, unlike high schools, it is not feasible to establish a university in nearly every community or county. This limitation triggers a significant reshuffling of young people, typically between ages seventeen and nineteen, away from communities without a university to those lucky enough to host one. College education, which generally increases mobility,25 leads to a trend where graduates often do not return to their home communities.26 In essence, leaving one’s hometown for college, particularly if one had to move fairly far to do so, tends to weaken local ties and encourages greater mobility after graduation as well.27 Several studies argue that the higher education system results in an internal brain drain, moving talent from regions with low education returns to places with higher returns.28
The conversion of many agricultural and mechanical (A&M) schools into regional universities over this time period may also have exacerbated the concentration of college grads. During the postwar period, essentially all normal schools (teachers’ colleges) and many A&Ms converted to regional universities.29 My research team and I identified 102 schools that were established prior to 1940 as agricultural colleges, polytechnics, or industrial, mechanical, and mining schools, which we collectively categorized under the “A&M” umbrella. Of these, six converted prior to 1945, thirty converted between 1945 and 1980, and an additional six converted after 1980.30 In their 2008 book, The Race between Education and Technology, Claudia Goldin and Lawrence Katz argue that the American educational system’s emphasis on general skills over vocational training from its early stages was crucial in a high-mobility society where workers could not predict which skills would be valued in their new hometowns.31 By switching focus to general skills and deemphasizing degrees useful in local industries, former A&Ms in agricultural or mining communities probably encouraged their graduates to search for more remunerative markets for their skills. The general idea here is that while universities attract some highly educated people, the benefits are offset in the long run by a brain drain of young people from other regions.32 Only a few locations are “winners,”33 lucky enough to host universities that attract research dollars and talent, and create spin-off industries leading to net population growth.34
Most accounts of the rise of Silicon Valley, Boston’s Route 128, North Carolina’s Research Triangle, and other tech clusters acknowledge one or more key local research universities that served to draw in and develop talent from around the world.35 There appear to be several key factors that distinguish universities that help their regions achieve takeoff from those that do not. One, already identified above, was an infusion of R&D money from the government during World War II, giving these areas an early start in high-tech innovation. Another is that the federal government enacted two laws in the 1980s that gave universities incentives to patent their faculty’s discoveries and made it more practicable for firms to license these technologies.36 One other factor is an alignment in knowledge spillovers between the university and preexisting local industries, particularly for universities and industries that are more research intensive.37 The same tech clusters that have high demand for university-produced knowledge also tend to have the highest demand for high-skilled and college-educated labor. One estimate found that the top fifteen metro areas for venture capital funding accounted for 55.9 percent of all high-skill employment in top-ten R&D industries between 2014 and 2018.38 These same metros, not coincidentally, also accounted for 57 percent of all granted patents over the 2015–18 period.
An additional contributor is that the emergence of Silicon Valley and the other tech clusters was a consequence of a system that went to great lengths to make higher education more widely available and more hierarchical. It is unclear from the literature whether these clusters owe their existence to the sheer increase in the number of college graduates after World War II or because elite private and public colleges concurrently took upon themselves the job of presorting and selecting students based on mid-century meritocratic ideals. It is easy to imagine that talent‑hungry start-ups benefited from both changes because they could legally use a growing number of college-educated applicants’ alma maters as a rough and ready means to screen them.39 The demographics of innovators are highly rarefied, partly because patenting itself is quite rare. Inventors are more likely to be male, come from well-off families, have parents who are inventors, are of relatively high cognitive ability (whether measured by standardized test scores or IQ tests), and have high education levels.40 Given these demographics, it seems quite likely that the rise of standardized testing and meritocratically selective universities probably played a key role in the ability of firms to identify the uppermost tier of innovative talent. Since innovation tends to be dependent on talent in the far-right tail of the income/education/ability distribution, and applying for college is many people’s first encounter with an aptitude test, it stands to reason that the emergence of highly selective colleges would play an important role in identifying and then concentrating talent.41
Yet the existing economics literature on the labor market impact of the expansion of the higher education system tends to lump together the effects of the large increase in college graduates with the fact that the system nearly simultaneously became more hierarchical.42 This tendency means that there is not a large body of evidence to draw on about which reform mattered more for the subsequent path of economic development. There is a small, but well-regarded literature, on how expanded access to education improved the allocation of talent, which at least in theory should improve economic growth.43 Whether it was due to broader human capital improvements or from employers being able to use collegiate reputation as a proxy for ability is unclear.44 As a practical matter, it also means that we do not know what the aggregate implications will be as selective colleges continue to abandon their SAT and ACT requirements, particularly for those employers (and regions) that have drawn most heavily from their alumni.
Since these changes occurred roughly contemporaneously, it is hard to know at first glance which change was most important. Even as states expanded access to a college education by creating regional universities, many also moved to designate certain universities (usually the land-grant) as the primary research-intensive (or “flagship”) university and make admission criteria stricter for these schools.45 California, for example, adopted its Master Plan for higher education in 1960, whereby undergraduate admission to its research university campuses would be restricted to the top 12.5 percent of students, the top third would attend the state colleges of the California State University system, and the remaining students could attend the community or junior colleges.46 This increasing selectivity probably played some role in the wage premium enjoyed by state flagship graduates relative to less selective in-state universities.47 Even with the adoption of the SAT or ACT, most state systems did not necessarily become as rigidly hierarchical as California. The Ohio State University, for example, is not an especially selective state flagship university: it has an acceptance rate of about 53 percent. In contrast, the University of Michigan’s rate is about 18 percent. In general, however, there are many bright students who do not go to a selective institution for a variety of reasons, and this tends to be more common in the center of the United States,48 so the effect of an SAT or ACT requirement was probably somewhat heterogeneous by state culture. Nonetheless, it seems likely that a standardized testing requirement changed the composition of students who attended the state flagship university.
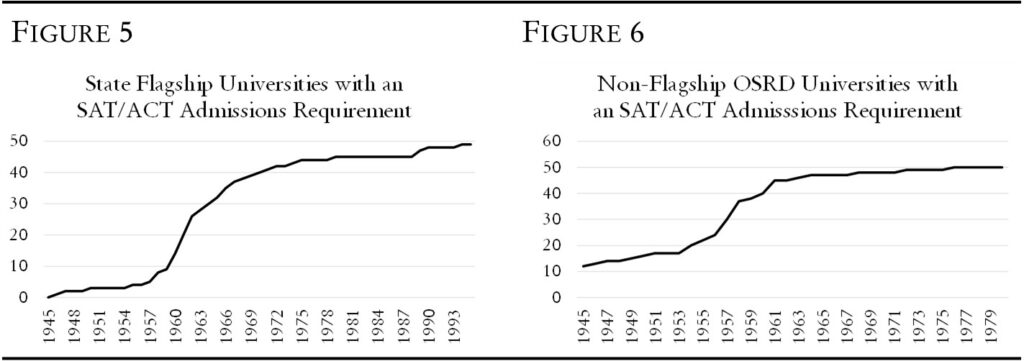
As shown in figure 5, many states adopted the SAT or ACT as an admission requirement from the 1950s through the early 1970s. Nicholas Lemann, in his 2000 book The Big Test: The Secret History of the American Meritocracy, on the history of the SAT, documented how the College Board (which administers the SAT) pushed for its adoption not just among the core group of elite East Coast private schools, but also among large public university systems that would validate its mission of “rationalizing” college admissions.49 The College Board’s efforts were successful: while no state flagships had a pre–World War II SAT or ACT requirement, almost all would by 1980.50 Similarly, almost all of the OSRD universities that were not state flagships would adopt the SAT as an admissions requirement only after the war.51 Of the sixty non‑state-flagship universities that received OSRD funding, twelve had an SAT or ACT admissions requirement by 1945. By 1960, this had leapt up to forty, and by 1970, it was forty-eight.52 Relative to the prewar period, it was thus both easier to get a college degree but harder for many students to get an education at their state’s most research-intensive institution.53
Unfortunately, there is not much published or publicly available evidence directly linking school selectivity or SAT/ACT scores with propensity to live and work in a tech cluster. A 2004 paper by Jeffrey Groen, using a survey of students from selective colleges, finds that those with higher SAT scores or those who attended a private university (as opposed to a public university or private college) were more likely to be living out of state in their thirties.54 A 2018 article in the Wall Street Journal used résumé data of a large group of people from online job postings to study where college graduates move after graduation.55 The authors found evidence consistent with Groen’s paper, showing, for example, that Cornell sends 25 percent of its graduates to San Francisco, New York, and Washington, D.C., alone. The same article showed that Harvard sends 7.1 percent of its graduates to San Francisco, but the much closer (and much less selective) University of Las Vegas only sends 2.1 percent of its graduates there. Washington is obviously a draw because of the federal government, but in general, the metros we think of as tech clusters are indeed reaping the lion’s share of the gains in income, innovation, and talent. More recent estimates have found that while attending an Ivy or similar elite private school instead of a highly selective public flagship institution matters relatively little for average wage differentials, it increases the chances of reaching the top 1 percent of the earnings distribution by 60 percent and triples one’s chances of working at a “prestigious firm.”56 As the highest-earning jobs and “prestigious firms” have become increasingly concentrated geographically, it seems likely that employers in these clusters are selecting in part on the basis of college of attendance.
Given all this, it is perhaps unsurprising that the takeoff of the tech clusters also coincides with the period when regional inequality begins to grow in the United States. U.S. regions were characterized by greater economic convergence over most of the twentieth century,57 but by 2013, the Berkeley economist Enrico Moretti was declaring that the United States was in the middle of a Great Divergence.58 Whereas past economic disparities were largely sectional, as the South lagged behind the North and West, significant economic gaps had now opened up within states as certain cities started pulling away from their hinterlands. Moretti and others have found that the growing agglomeration in innovation, the rising college wage premium, and the differential migration patterns of college graduates have all been playing key roles.59 Much research still needs to be done to more clearly establish how changes in the higher education system enabled the rise of the tech clusters. Nonetheless, available evidence suggests that the postwar efforts to fund research-intensive universities and to expand the reach of higher education, while simultaneously making it more hierarchical, may have played an important role in the concentration of talent and innovation.60
The Potential Flaws of the Tech Cluster Model
While few would disagree with Moretti’s findings of a Great Divergence, in which the United States splits into successful, well-educated metropoles and struggling, less-educated peripheries, the question remains whether it has anything to do with the slowing growth rates in the economy as a whole.
What are some possible mechanisms by which the tech clusters could have played a role? While co-location unquestionably produces generative knowledge spillovers, some of the other peer effects may be negative, such as when people lapse into groupthink.61 Although groupthink is difficult to measure, it is hard to look at some of the innovations that have emerged out of Silicon Valley and other clusters over the years and not ask oneself whether the people involved were seized by a form of groupthink. The great rise and fall of interest in cryptocurrency, for example, seems like the kind of bubble where a great many people succumbed to groupthink that generated very little in measurable productive value.
Beyond groupthink, there may be other ways that concentration could both increase an innovator’s patenting rate while pushing them to produce more marginal and less pathbreaking technologies. Innovation is influenced not by peer effects but also by the problems that innovators see in their environment and that capture their interest, either as adults or as children.62 A recent paper by Jacob Moscona and Karthik Sastry highlighted how this works at a global scale.63 They investigated how R&D dollars tend to be directed at agricultural pests that are a problem in high-income countries where the research happens but not in the developing countries where the technology is sold, resulting in significantly lower crop productivity globally. A similar mismatch between the needs and interests of twenty- or thirty-something innovators living in the Bay Area and non-college-educated middle-aged workers living elsewhere may also be causing the United States to generate too much “inappropriate” technology.64
Another way in which tech clusters’ promotion of strong, peer-driven research networks may be leading to slower research productivity is that connecting everyone into the same network also makes it easier for a small number of innovators or researchers to police their peers. There is some evidence for Max Planck’s adage that science advances one funeral at a time,65 but by the same process, it could easily be the case that a peer-effects-driven model may lead to more incremental, less original innovation at scale because centralized networks make up-and-comers more afraid of challenging the well-connected. This could help lead to the process described above by Bloom and his coauthors: even as the number of researchers and papers increases in a networked cluster, the marginal impact of each paper declines. Some evidence suggests that scientific papers and patents are in fact becoming more deferential to previously published work and less likely to disrupt the chain of citations and references.66 By this logic, geographically diffuse researchers may be less productive in the ways that urban economists typically measure output (fewer papers, fewer patents, etc.), but they may be more creative, original, and disruptive because these researchers worry less about having to see someone in person whose work they publicly disagree with.
At a larger scale, the best evidence that the formation of tech clusters and the concentration of talent may have led to herding is the patenting trends by technological field. Brian Kelly and coauthors recently devised a way to consistently group patents by technology class from 1840 to the present.67 They find that as recently as the 1970s, patenting was relatively evenly distributed across classes, but after the 1970s, electronics and computing takes a growing share of patents. By 2000, that one field made up a solid majority of patents filed. It is of course possible that the good ideas were exhausted in agriculture, rubbers and plastics, chemical manufacturing, and machinery manufacturing all around the same time, leaving only computers and electronics as the most fruitful innovation frontier. But such a coincidence would be surprising.
The tech-cluster-driven focus on computing and electronics may itself be another part of the problem. Economists have been arguing since at least the 1980s about whether increased computing power is improving aggregate labor productivity, with some recent work emphasizing that the nature of recent IT innovations may innately lead to no or low productivity growth.68 It is beyond the scope of this essay to disentangle why digitization has not boosted labor productivity more, but as a general observation, part of the problem may just be that the U.S. economy allows so much human capital to flow into a single technology sector that has struggled to deliver labor productivity improvements for forty years and counting.
Finally, the dependence of the clusters on research universities may also be at fault. One problem, as stated above, may be that grant funding disproportionately goes to a select number of universities. This degree of concentration may be counterproductive, as suggested by a study of Sweden’s reforms to decentralize higher education, which found that the reforms led to higher aggregate research productivity as growth in the “new” universities more than compensated for the decline in the “old” universities.69 Universities also may not offer a strong output or innovation advantage over other types of research institutes.70 Inasmuch as the scientific know-how and talent is dependent on the prerogatives of the local research universities, the whims and priorities of the faculty and administrators may thus distort the direction of local innovation.
A good example of how universities can both promote and distort the direction of local innovation is the creation of the mRNA vaccine, which was used to subdue the Covid pandemic. Katalin Kariko, who just shared the Nobel Prize in Medicine with Drew Weissman, famously maintained only a tenuous grasp on an academic career at the University of Pennsylvania while she worked to advance the fundamental science behind the vaccines. She struggled to win grants (including from the National Institutes of Health) on the merits of the mRNA technology and was ultimately demoted and removed from Penn’s tenure track for research professors. Kariko just managed to hang on by landing in Weissman’s lab after her demotion. Penn’s fraught relationship with Kariko almost cost the world a major welfare-enhancing technology, but also did not even lead to a successful technology cluster centered in Philadelphia when the vaccine had proved itself. By the time Covid-19 came around, Kariko had already left Penn and was working for BioNTech, a pharmaceutical start-up centered on the mRNA technology based in Mainz, Germany.71
Moving Beyond Silicon Wherever
Tyler Cowen himself recently declared that the Great Stagnation may be over. At the 2023 Great Stagnation Summit in Cambridge, UK, where he gave the keynote address, Cowen pointed to developments in biomedical technologies (such as the mRNA vaccine), AI, and clean technologies as evidence that fundamental advances were finally afoot. It is, of course, too soon to say whether these particular technologies will spur faster growth, but after the pandemic, the U.S. government has itself become more interested in reviving scientific progress to create broadly-based growth. Look no further than Congress’s recent embrace of industrial policy for semiconductors and clean technologies in the chips and Science Act and the Inflation Reduction Act. These were funded to the tune of $52.7 and $891 billion, respectively. While industrial policy may be back in vogue in the post-pandemic era, the same cannot be said for place-based policies that would look to spend money in distressed places directly. Congress also passed in 2022 the recompete Act and the Regional Technology Hub program as place-based policies to boost distressed local labor markets, but only authorized $1 billion and $10 billion for them, respectively.72
Many economists nonetheless support Congress’s reluctance to start new place-based programs, in part out of a deference to the innovative power of the tech clusters. For example, a 2018 survey paper for the Brookings Institution by Benjamin Austin, Larry Summers, and Edward Glaeser entitled “Jobs for the Heartland: Place-Based Policies in 21st Century America” captures this hesitancy about place-based policies.73 The authors acknowledge that employment disparities are growing between regions and are becoming more rigid over time. Yet after reviewing the relevant literature on previous place-based policies, the authors note that “it is impossible to know whether a relocation of capital and labor from Los Angeles to Kentucky will lead to benefits in Kentucky that are large enough to offset the [productivity] losses in Los Angeles.”
After dismissing the desirability of trying to directly create new technology hubs in distressed places, the authors conclude the paper with an endorsement for an enhanced earned income tax credit (EITC) that would be more generous to single-person households and in distressed locations. While this policy may indeed work on its own terms, it does not really offer much for policymakers interested in local revitalization.
The authors are correct that we do not know what relocating start-ups from Los Angeles’s Silicon Beach to Eastern Kentucky will lead to. Yet even if there is no connection between the rise of the tech clusters and stagnating productivity growth, it may not make much sense to encourage talent to keep moving to the same few places because of other externalities. A recent working paper by Tim Bartik and Nathan Sotherland points out that the local multiplier effects of an employment demand boost to high-skill workers eventually plateau because congestion effects ultimately cancel out even very powerful agglomeration effects.74 For distressed regions, on the other hand, these multipliers can still be reasonably high. Encouraging college-educated workers to branch out to distressed regions may yield more benefits than the current consensus in the economics profession would suggest. Federal programs that encouraged researchers and innovators to physically relocate to distressed regions could very well catalyze new jobs and technologies that address the needs of the people on the ground.
Concretely, even if a top software engineer who relocates to Eastern Kentucky becomes less likely to come up with a start-up with a unicorn valuation or patent a new technology, this engineer may create value in other ways, such as by improving local businesses’ IT or streamlining their operations to boost their productivity. Inasmuch as the internal brain drain phenomenon discussed above is most severe at the top of the ability distribution, then it is very likely that many communities are stagnating because their best and brightest have been systematically moving away for several generations.75 The benefits from having college-educated workers in a local community seem to be substantial, even on the wages of non-college workers.76 Further, states with net in-migration of college-educated workers saw faster growth in labor productivity between 2012 and 2019: productivity rose 9.1 percent in the “brain gain” states, while rising only 3.7 percent in “brain drain” states,77 although it is unfortunately unclear in the data whether the productivity boost in brain gain states extends to those without a college degree. Nonetheless, given the real benefits to distressed communities from having more highly educated workers versus the abstract possibility that these workers will innovate less, encouraging people to decamp for Eastern Kentucky may be a real-world experiment worth trying.
This article originally appeared in American Affairs Volume VIII, Number 1 (Spring 2024): 3–28.
Notes
I would like to gratefully acknowledge funding assistance for the research that went into this article from the American Affairs Foundation.
1 Tyler Cowen, The Great Stagnation: How America Ate All the Low-Hanging Fruit of Modern History, Got Sick, and Will (Eventually) Feel Better (New York: Penguin, 2011). Cowen is perhaps unnecessarily deferential to the readers’ sense that the internet and the personal computer are major innovations that represent a radical change. While one would not dispute that the internet has radically changed many aspects of our lives, the internet is also infamous for having had little apparent impact on worker productivity or growth. Robert Solow, the 1987 winner of the Nobel Prize in Economics, once quipped in a 1987 article for the New York Review of Books, “You can see the computer age everywhere but in the productivity statistics.” This disconnect between the rise of computers and its lack of measurable impact on productivity came to be called the “Solow Paradox,” and it remains an important unresolved problem in labor economics.
2 There is even a website dedicated to cataloguing all the ways the economy has underwhelmed since 1971: https://wtfhappenedin1971.com.
3 Philipp Boeing and Paul Hünermund, “A Global Decline in Research Productivity? Evidence from China and Germany,” Economics Letters 197, (December 2020): 109646; Peter Cauwels and Didier Sornette, “Are ‘Flow of Ideas’ and ‘Research Productivity’ in Secular Decline?,” Technological Forecasting & Social Change 174, (2022): 121267.
4 Austan Goolsbee and Chad Syverson, “The Strange and Awful Path of Productivity in the U.S. Construction Sector,” NBER Working Papers, no. 30845 (February 2023).
5 Dan Andrews, Chiara Criscuolo, and Peter N. Gal, “The Best versus the Rest: Divergence across Firms during the Global Productivity Slowdown,” CEP Discussion Papers, no. 1645 (August 2019); Ufuk Akcigit and Sina T. Ates, “Ten Facts on Declining Business Dynamism and Lessons from Endogenous Growth Theory,” American Economic Journal: Macroeconomics 13, no. 1 (January 2021): 257–98.
6 Nicholas Bloom, Charles I. Jones, John Van Reenen, and Michael Webb, “Are Ideas Getting Harder to Find?,” American Economic Review 110, no. 4 (April 2020): 1104–44.
7 Claudia Goldin and Lawrence F. Katz, The Race between Education and Technology (Cambridge: Harvard University Press, 2008); Enrico Moretti, The New Geography of Jobs (Boston: Houghton Mifflin Harcourt, 2012).
8 Edward L. Glaeser and Naomi Hausman, “The Spatial Mismatch between Innovation and Joblessness,” Innovation Policy and the Economy 20, no. 1 (2020): 233–99.
9 Mark Koyama and Jared Rubin, How the World Became Rich: The Historical Origins of Economic Growth (Cambridge, UK: Polity Press, 2022).
10 Peter Ganong and Daniel Shoag, “Why Has Regional Income Convergence in the U.S. Declined?,” Journal of Urban Economics 102 (November 2017): 76–90; Devin Michelle Bunten, “Is the Rent Too High? Aggregate Implications of Local Land-Use Regulation,” FEDS Working Papers, no. 2017-064 (June 2017).
11 Fatih Karahan, Benjamin Pugsley, and Ayşegül Şahin, “Demographic Origins of the Startup Deficit,” NBER Working Papers, no. 25874 (May 2019); Jesús Fernández-Villaverde, Gustavo Ventura, and Wen Yao, “The Wealth of Working Nations,” NBER Working Papers, no. 31914 (November 2023). There are also debates among economists about whether we are properly measuring productivity growth, particularly in the service sector, which has grown considerably in the past few decades. See, e.g., Chang-Tai Hsieh and Esteban Rossi-Hansberg, “The Industrial Revolution in Services,” Journal of Political Economy: Macroeconomics 1, no. 1 (March 2023): 3–42. This is particularly relevant for examining the link between the rise of the tech clusters and slowing productivity growth, as research suggests that high-tech job growth is disproportionately likely to create jobs in the service sector: Enrico Moretti, “Local Multipliers,” American Economic Review 100, no. 2 (May 2010): 373–77. The implication is that the productivity slowdown may be a statistical illusion, a function of growth in R&D-intensive jobs spurring growth in service sector jobs, so that productivity appears to be slowing down only because productivity improvements in those occupations is missed by the Bureau of Labor Statistics. Nonetheless, most scholars accept that productivity in the service sector is lower than in the manufacturing sector. For a review of this literature, see, e.g., Ronald Schettkat and Lara Yocarini, “The Shift to Services: A Review of the Literature,” IZA Discussion Papers, no. 964 (December 2003). Thus. the fact that tech clusters tend to generate much more employment growth in the former rather than the latter is bound to contribute to slower productivity growth irrespective of measurement issues.
12 There is in fact a growing literature asking whether improvements to the funding processes of the NSF and National Institutes of Health to back riskier research may yield a more welfare-enhancing research stream; see, e.g., Chiara Franzoni, Paula Stephan, and Reinhilde Veugelers, “Funding Risky Research,” NBER Working Papers, no. 28905 (June 2021).
13 Among many others: Enrico Moretti, “The Effect of High-Tech Clusters on the Productivity of Top Inventors,” American Economic Review 111, no. 10 (October 2021): 3328–75; Adam B. Jaffe, Manuel Trajtenberg, and Rebecca Henderson, “Geographic Localization of Knowledge Spillovers as Evidence by Patent Citations,” Quarterly Journal of Economics 108, no. 3 (August 1993): 577–98; Ufuk Akcigit, Santiago Caicedo, Ernest Miguelez, Stefanie Stantcheva, and Valerio Sterzi, “Dancing with the Stars: Innovation through Interactions,” NBER Working Papers, no. 24466 (March 2018).
14 For example, Robert M. Solow, “A Contribution to the Theory of Economic Growth,” Quarterly Journal of Economics 70, no. 1 (February 1956): 65–94.
15 See Glaeser and Hausman, “The Spatial Mismatch between Innovation and Joblessness,” for a good overview of this paradigm. This deference to the productivity benefits of tech clusters is not universal in the economics profession but is reasonably widespread. For example, even papers that argue for the welfare-enhancing advantages of doing place-based redistribution nonetheless often concede the premise that redistributing from the highly productive tech clusters to distressed regions with lower productivity will generate substantial efficiency costs. See, e.g., Cecile Gaubert, Patrick M. Kline, and Danny Yagan, “Place-Based Redistribution,” NBER Working Paper, no. 28337 (January 2021).
16 Edward L. Glaeser, Triumph of the City: How Our Greatest Invention Makes Us Richer, Smarter, Greener, Healthier, and Happier (New York: Penguin, 2012); Steven Klepper, “The Origin and Growth of Industry Clusters: The Making of Silicon Valley,” Journal of Urban Economics 67, no. 1 (January 2010): 15–32.
17 Glaeser and Hausman, “The Spatial Mismatch between Innovation and Joblessness.”
18 Michael J. Andrews and Alexander Whalley, “150 Years of the Geography of Innovation,” Regional Science and Urban Economics 94 (May 2022): 103627.
19 Daniel P. Gross and Bhaven N. Sampat, “America, Jump-Started: World War II R&D and the Takeoff of the U.S. Innovation System,” American Economic Review 113, no. 12 (December 2023): 3323–56.
20 Vannevar Bush, Science—the Endless Frontier (Washington, D.C.: United States Government Printing Office, 1945).
21 Daniel Lee Kleinman, Politics on the Endless Frontier: Postwar Research Policy in the United States (Durham, NC: Duke University Press, 1995).
22 See, e.g., ch.7 and 8 from: John Aubrey Douglass, The California Idea and American Higher Education: 1850 to the 1960 Master Plan (Stanford: Stanford University Press, 2000).
23 Goldin and Katz, The Race Between Education and Technology.
24 Goldin and Katz, The Race Between Education and Technology.
25 Abigail Wozniak, “Are College Graduates More Responsive to Distant Labor Market Opportunities?,” Journal of Human Resources 45, no. 4 (October 2010): 944–70; Ofer Malamud and Abigail Wozniak, “The Impact of College on Migration,” Journal of Human Resources 47, no. 4 (October 2012): 913–50.
26 Xiao Li, “Migration Behaviors and Educational Attainment of Metro versus Non-Metro Youth,” Rural Sociology 87, no. 4 (December 2022): 1302–39.
27 For an exploration of how the strength of local ties can influence local economies, see: Mike Zabek, “Local Ties in Spatial Equilibrium,” FEDS Working Paper, no. 2019-080 (November 2019).
28 Jaison R. Abel and Richard Deitz, “Do Colleges and Universities Increase Their Region’s Human Capital,” Journal of Economic Geography 12, no. 3 (May 2012): 667–91; John Bound et al., “Trade in University Training: Cross-State Variation in the Production and Stock of College-Educated Labor,” Journal of Econometrics 121, no. 1–2 (July-August 2004): 143–73; William M. Bowen and Haifeng Qian, “State Spending for Higher Education: Does it Improve Economic Performance,” Regional Science Policy & Practice 9, no. 1 (March 2017): 7–23; Felicia Ionescu and Linnea A. Polgreen, “A Theory of Brain Drain and Public Funding for Higher Education in the United States,” American Economic Review: Papers & Proceedings 99, no. 2 (May 2009): 517–21.
29 Greg Howard, Russell Weinstein, and Yuhao Yang, “Do Universities Improve Local Economic Resilience?,” Review of Economics and Statistics, forthcoming (June 2022).
30 This list is not exhaustive and research on the decline of the A&M designation is ongoing. We marked a school as converting from A&M to university when it either started offering bachelors of arts degrees; adopted the university designation and started humanities departments; or if neither of those dates are known, we use the date of a name change that indicates that the school was dropping its former A&M-type designation.
31 Goldin and Katz, The Race between Education and Technology.
32 This is thematically discussed in the popular press as well. Shad White, the state auditor of Mississippi, recently complained that, “[State taxpayers] might as well cut a check to Atlanta every year,” in reference to the fact that only about half of Mississippi’s public university graduates work in-state three years after graduation (Cameron McWhirter, “The American South is Booming. Why is Mississippi Left Behind?,” Wall Street Journal, December 31, 2023).
33 Abel and Dietz, “Do Colleges and Universities Increase Their Region’s Human Capital.”
34 For example, one paper estimated that only 37 percent of counties with universities attracted more high-skilled workers than the number of higher-education degrees they produced from 1990 to 2000: E. Jason Baron, Shawn Kantor, Alexander Whalley, “Extending the Reach of Research Universities: A Proposal for Productivity Growth in Lagging Communities,” Place-Based Policies for Shared Economic Growth, eds. Jay Shambaugh and Ryan Nunn (Washington, D.C.: Brookings Institution, 2018), 157–84.
35 For example, Edward L. Glaeser’s, The Triumph of the City puts Stanford University right in the center of the narrative about the rise of Silicon Valley. Not only did its graduates play an important role in supplying talent to some of the semiconductor firms that gave Silicon Valley its name, such as Shockley Semiconductor Laboratory and Fairchild Semiconductor, but decades later, it was also the school that the founders of Google (Sergey Brin and Larry Page), among other tech luminaries, attended.
36 These are the 1980 Bayh-Dole Act and 1984 Trademark Clarification Act, which gave universities and faculty direct incentives to patent and license their discoveries to firms. Prior to Bayh-Dole, universities generally shied away from doing so for fear of compromising the ideal of open science and distracting the university from the pursuit of pure science. Bayh-Dole allowed universities to own the patent rights and royalties from their innovations even for federally funded research. In 1984, the Trademark Clarification Act removed restrictions on license exclusivity, which improved the attractiveness of licensing university innovations for private businesses: Naomi Hausman, “University Innovation and Local Economic Growth,” Review of Economics and Statistics 104, no. 4 (July 2022): 718–25.
37 Shawn Kantor and Alexander Whalley, “Knowledge Spillovers from Research Universities: Evidence from Endowment Value Shocks,” Review of Economics and Statistics 96, no. 1 (March 2014): 171–88; Hausman, “University Innovation and Local Economic Growth.”
38 William R. Kerr and Frederic Robert-Nicoud, “Tech Clusters,” Journal of Economic Perspectives 34, no. 3 (Summer 2020): 50–76. These cities are, in order of share of total 2015–18 venture capital investment: San Francisco (Bay Area), New York, Boston, Los Angeles, Seattle, San Diego, Chicago, Washington, DC, Miami, Denver, Austin, Philadelphia, Atlanta, Minneapolis–St. Paul, and Raleigh-Durham. The authors define “high-skilled” workers as those with a college degree or more and making at least $50,000 a year. They define the top ten R&D industries as those with the highest R&D per worker: software publishers; pharmaceuticals and medicines; other computer and electronic products; data processing, hosting and related services; communications equipment; semiconductor and other electronic components; navigational, measuring, electromedical, and control instruments; pesticide, fertilizer, and other agricultural chemicals; aerospace products and parts; and scientific research and development services. Source: National Science Foundation, Business Research and Development: 2017, Detailed Statistical Tables (NSF 20-311) (Washington, D.C., National Science Foundation, 2017).
39 Employers could not use ability tests themselves after Griggs v. Duke Power Co. (1971), when the Supreme Court effectively outlawed these tests on disparate impact grounds. Several commentators have noted ironically that Griggs paved the way for employers to use a college degree as a de facto ability screen that results in (legal) disparate impact (e.g., Hess and Addison, 2019; Fuller and Raman, 2017).
40 Taehyun Jung and Olof Ejermo, “Demographic Patterns and Trends in Patenting: Gender, Age, and Education of Inventors,” Technological Forecasting and Social Change 86, (July 2014): 110–24; Philippe Aghion, Ufuk Akcigit, Ari Hyytinen, and Otto Toivanen, “The Social Origins of Inventors,” NBER Working Papers, no. 24110 (December 2017); Alex Bell et al., “Who Becomes an Inventor in America? The Importance of Exposure to Innovation,” Quarterly Journal of Economics 134, no. 2 (May 2019): 647–713.
41 Caroline M. Hoxby, “The Changing Selectivity of American Colleges,” Journal of Economic Perspectives 23, no. 4 (Fall 2009): 95–118.
42 For example, Goldin and Katz, The Race Between Education and Technology offers an extensive review of the rise of mass education in the United States from the founding to the early 2000s, but does not mention the words “standardized testing,” “SAT,” or “ACT” or its equivalents.
43 Kevin M. Murphy, Andrei Shleifer, Robert W. Vishny, “The Allocation of Talent: Implications for Growth,” Quarterly Journal of Economics 106, no. 2 (May 1991): 503–30; Chang-Tai Hsieh et al., “The Allocation of Talent and U.S. Economic Growth,” Econometrica 87, no. 5 (September 2019): 1439–74; Hans K. Hvide, “Education and the Allocation of Talent,” Journal of Labor Economics 21, no. 4 (October 2003): 945–76.
44 For evidence that employers use college of attendance as a screening device for underlying ability, see: Peter Arcidiacono, Patrick Bayer, and Aurel Hizmo, “Beyond Signaling and Human Capital: Education and the Revelation of Ability,” American Economic Journal: Applied Economics 2, no. 4 (October 2010): 76–104; Brad J. Hershbein, “Worker Signals among New College Graduates: The Role of Selectivity and GPA,” Upjohn Institute Working Papers, no. 13-190 (January 2013). This then translates into higher earnings for graduates from selective universities, see, e.g.: Eleanor Wiske Dillon and Jeffrey Andrew Smith, “The Consequences of Academic Match Between Students and Colleges,” Journal of Human Resources 58, no. 6 (November 2023): 768–808; Dan A. Black and Jeffrey A. Smith, “Estimating the Returns to College Quality with Multiple Proxies for Quality,” Journal of Labor Economics 24, no. 3 (July 2006): 701–28.
45 Goldin and Katz, The Race Between Education and Technology.
46 Douglass, The California Idea and American Higher Education.
47 Mark Hoekstra, “The Effect of Attending the Flagship State University on Earnings: A Discontinuity-Based Approach,” Review of Economics and Statistics 91, no. 4 (November 2009): 717–24.
48 Caroline M. Hoxby and Christopher Avery, “The Missing ‘One-Offs’: the Hidden Supply of High-Achieving, Low-Income Students,” NBER Working Papers, no. 18586 (December 2012).
49 Nicholas Lemann, The Big Test: The Secret History of the American Meritocracy (New York: Farrar, Straus, and Giroux, 2000).
50 The first state to require a standardized test for admission was Colorado in 1946, which asked for an applicant’s ACT score. The first state flagship to require the SAT was Rutgers in New Jersey in 1947, which is probably not a coincidence as the College Board’s sister nonprofit that scores the SAT, Educational Testing Service (ETS), is based out of New Jersey.
51 I am grateful to Daniel Gross for sharing with me his data on OSRD awards by institution.
52 For nine universities, we were unable to ascertain when or whether the school ever required the SAT or ACT for admission: Boston University, Catholic University, Cooper Union, Depauw, Illinois Institute of Technology, Loyola University (Chicago), Newark College of Engineering (now the New Jersey Institute of Technology), and St. Louis University. A tenth university, Case Western Reserve University, is a product of a 1967 merger between the Case Institute of Technology and the Western Reserve University. Western Reserve started requiring the SAT in 1955 and Case started requiring the SAT in 1958. Since both Case and Western Reserve independently received OSRD money, they are included separately toward the total count of 60 universities and in the counts in figure 5.
53 Hoxby, “The Changing Selectivity of American Colleges.”
54 Jeffrey A. Groen, “The Effect of College Location on Migration of College-Educated Labor,” Journal of Econometrics 121, no. 1-2 (July-August 2004): 125–42.
55 Danny Dougherty, Brian McGill, Dante Chinni, and Aaron Zitner, “Where Graduates Move after College,” Wall Street Journal, May 15, 2018.
56 Raj Chetty, David J. Deming, and John N. Friedman, “Diversifying Society’s Leaders? The Determinants and Causal Effects of Admission to Highly Selective Private Colleges,” NBER Working Papers, no. 31492 (October 2023).
57 Olivier Blanchard and Lawrence F. Katz, “Regional Evolutions,” Brookings Papers on Economic Activity 23, no. 1 (1992): 1–76; Robert J. Barro and Xavier Sala-i-Martin, “Convergence,” Journal of Political Economy 100, no. 2 (April 1992): 223–51.
58 Moretti, The New Geography of Jobs.
59 Rebecca Diamond, “The Determinants and Welfare Implications of U.S. Workers’ Diverging Location Choices by Skill: 1980–2000,” American Economic Review 106, no. 3 (March 2016): 479–524; Joseph Gyourko, Christopher Mayer, and Todd Sinai, “Superstar Cities,” American Economic Journal: Economic Policy 5, no. 4 (November 2013): 167–99; Richard Florida, “The Economic Geography of Talent,” Annals of the Association of American Geographers 92, no. 4 (2002): 743–55; Enrico Berkes and Ruben Gaetani, “Income Segregation and the Rise of the Knowledge Economy,” American Economic Journal: Applied Economics 15, no. 2 (April 2023): 69–102.
60 Gross and Sampat’s work shows how the role of the increasingly hierarchical university system may be underappreciated. The authors find that it took until about the 1960s before the agglomeration effects in some of the OSRD clusters began to really coalesce. One reason could be that there needed to be a greater supply of college grads to fuel these industries’ growth than was available during the war. However, if that were the case, then one might have expected that the 1944 GI Bill, which caused a surge in college enrollment among returning vets, would have helped these clusters to achieve take-off while the OSRD work was still fresh in the minds of its scientists and engineers. As noted above, however, most colleges were not particularly selective in 1945 and it would take until the mid-1960s before a critical mass of both public and private colleges had SAT or ACT mandates in place long enough for the first graduates to be plausibly considered as being pre-selected on the basis of aptitude. The post-1965 immigration reforms that allowed tech firms to recruit employees internationally also may have played a role in the ability of tech clusters to attract talent. For the role of H-1B visas in innovation by immigrants, see: William R. Kerr and William F. Lincoln, “The Supply Side of Innovation: H-1B Visa Reforms and U.S. Ethnic Invention,” Journal of Labor Economics 28, no. 3 (July 2010): 473–508.
61 For example, look no further than fin de siècle Vienna as a cluster of intellectuals where peer effects caused pseudo-scientific ideas like psychoanalysis to proliferate.
62 Bell et al., “Who Becomes an Inventor in America? The Importance of Exposure to Innovation”; Caroline Viola Fry, “Crisis and the Trajectory of Science: Evidence from the 2014 Ebola Outbreak,” Review of Economics and Statistics 105, no. 4 (July 2023): 1028–38; Sarada Sarada, Michael J. Andrews, and Nicolas L. Ziebarth, “Changes in the Demographics of American Inventors, 1870-1940,” Explorations in Economic History 74 (October 2019): 101275.
63 Jacob Moscona and Karthik Sastry, “Inappropriate Technology: Evidence from Global Agricultural,” SSRN Working Paper, no. 3886019 (November 2022).
64 One example is the rise of “leisure-enhancing” technological change, where recent improvements in entertainment and social media may have lowered our total productivity because these are technologies meant to nonproductively monetize our attention. See: Łukasz Rachel, “Leisure-Enhancing Technological Change,” Working Paper, November 21, 2022. In fact, there is some evidence that steadily improving video games have lowered young men’s labor supply. See: Mark Aguiar et al., “Leisure Luxuries and the Labor Supply of Young Men,” Journal of Political Economy 129, no. 2 (February 2021): 337–82.
65 Pierre Azoulay, Christian Fons-Rosen, and Joshua S. Graff Zivin, “Does Science Advance One Funeral at a Time?” American Economic Review 109, no. 8 (August 2019): 2889–920.
66 Michael Park, Erin Leahey, and Russell J. Funk, “Papers and Patents are Becoming Less Disruptive over Time,” Nature 613, (2023): 138–44.
67 Bryan Kelly, Dimitris Papanikolaou, Amit Seru, and Matt Taddy, “Measuring Technological Innovation over the Long Run,” American Economic Review: Insights 3, no. 3 (September 2021): 303–20.
68 Daron Acemoglu et al., “Return of the Solow Paradox? IT, Productivity, and Employment in Employment in U.S. Manufacturing,” American Economic Review: Papers and Proceedings 104, no. 5 (May 2014): 394–99; Daron Acemoglu and Pascual Restrepo, “Automation and New Tasks: How Technology Displaces and Reinstates Labor,” Journal of Economic Perspectives 33, no. 2 (Spring 2019): 3–30.
69 Roland Andersson, John M. Quigley, and Mats Wilhelmsson, “Urbanization, Productivity, and Innovation: Evidence from Investment in Higher Education,” Journal of Urban Economics 66, no. 1 (July 2009): 2–15.
70 Michael J. Andrews, “How Do Institutions of Higher Education Affect Local Invention? Evidence from the Establishment of U.S. Colleges,” American Economic Journal: Economic Policy 15, no. 2 (May 2023): 1–41.
71 Moderna, the other company using Kariko and Weissman’s patent, is based in Cambridge, Massachusetts.
72 Although Congress was authorized to spend $11 billion between the two programs, as of this writing, it has only appropriated $500 million to the Regional Technology Hubs program and $200 million to the Recompete Act pilot program.
73 Benjamin Austin, Edward L. Glaeser, and Lawrence Summers, “Jobs for the Heartland: Place-Based Policies in 21st-Century America,” Brookings Papers on Economic Activity (Spring 2018): 151–240.
74 Timothy J. Bartik and Nathan Sotherland, “Local Job Multipliers in the United States: Variation with Local Characteristics and with High-Tech Shocks,” Upjohn Institute Working Papers, no. 19-301.
75 The real-world effects of this brain drain are not well-studied. Preliminarily, I used the U.S. Patent and Trademark Office patent data, provided to me courtesy of Enrico Berkes, spanning 1945–2014 and performed an event study analysis on the effects of an SAT/ACT admissions requirement on each county’s logged annual patent count. Event studies can be biased when all observations become treated (in this case, when all counties are in states with an SAT/ACT state flagship admissions requirement). To minimize that bias, I restricted the sample to just 1945–88, leaving Washington, D.C., North Dakota, Oklahoma, Wisconsin, and Washington State as my control states. I controlled for the amount of NSF funding a county was receiving by means of a “shift-share” instrumental variable, where I took the OSRD university-grant shares for each county and then assigned NSF grants to each county by multiplying annual Congressional NSF appropriations by the OSRD shares. This approach should be viewed as a first pass at the question, but I nonetheless find that patenting starts to rise substantially in counties with state flagships about four years after an SAT/ACT admissions requirement (reflecting the modal amount of time it takes to graduate from college). Patenting in non-flagship counties initially appears unaffected, but by about fifteen to eighteen years ex post, it starts to see small declines. This is suggestive of a reallocation effect, but further investigation is required. For information on Enrico Berkes’s patent data, see: Enrico Berkes, “Comprehensive Universe of U.S. Patents (CUSP): Data and Facts,” Working Paper, May 9, 2018.
76 Enrico Moretti, “Estimating the Social Return to Higher Education: Evidence from Longitudinal and Repeated Cross-Sectional Data,” Journal of Econometrics 121, no. 1-2 (July-August 2004): 175–212.
77 State labor productivity measures come from the Bureau of Labor Statistics’ (BLS) series on state labor productivity. These data cover 2007–22 and are indexed to 2012. Brain gain/brain drain calculations come from a 2019 report by the U.S. Congress Joint Economic Committee’s Social Capital Project: U.S. Senate Joint Economic Committee—Republicans, “Losing Our Minds: Brain Drain across the United States,” Social Capital Project Reports, no. 2-19 (April 2019). Absolute Net Brain Drain is defined in their data as the percentage of highly educated among leavers minus the percentage of highly educated among entrants, where highly educated are those in the top third of the national education distribution of adults aged 31–40. States with a negative value of Absolute Net Brain Drain are experiencing brain gain and those with positive values are experiencing brain drain.
