Since the start of the war in Ukraine, the question of the size of the Russian and Chinese economies—relative to Western economies—has become highly significant. Early on, policymakers compared the Russian GDP to that of Spain or Italy, for example, as a way of minimizing its global importance. Now that these geopolitical tensions have resurrected Cold War blocs, it is crucial to clarify our understanding of the real size and importance of these economies.
Simple GDP statistics have arguably lulled the West into a false sense of security. By GDP, Western economies appear dominant and their capacity to impose sanctions decisive. But the West’s reliance on service sectors—and the relative weakness of directly productive sectors like manufacturing, mining, and agriculture—introduces critical vulnerabilities in goods production and supply chains. In times of peace and unimpeded trade, such vulnerabilities may seem insignificant. In periods of deglobalization, geopolitical competition, and state-versus-state conflict, however, these weaknesses can have profound impacts, while basic productive sectors take on greater importance. A clearer view of these realities implies a reassessment of the West’s strategic position.
The Pitfalls of Measuring GDP
Since World War II, GDP has been the indicator typically used to determine the size and power of an economy.1 GDP measures the wealth created in a given period, as valued by the market. While it is an important indicator, it also imperfectly assesses real wealth2 and does not fully measure the productive capacities of a country. Many criticisms have been leveled against it, and other quantitative measures—of production or exports, for example—are often used as a complement. To be able to compare economies, however, metrics need to use a common unit of measurement, most often the dollar. An obvious solution is to use the exchange rates at a given period. Yet this apparently simple solution is also an unsatisfactory one, since exchange rates do not necessarily reflect economic reality. Exchange rates are subject to speculative fluctuations,3 both upwards and downwards, in the money markets.4
For these reasons, the purchasing power parity (or PPP) method is frequently used.5 PPP measures capture relative prices. In other words, PPP captures the relative price ratios, in national currency, of the same good or service across different countries.6 To be sure, the hypothesis that consumers across different countries would use the same product is a fragile one given the cultural specificities of the consumers. Hence the PPP method also has its problems and potential biases. Nevertheless, it is clearly more robust than the exchange rate method when comparing economies. PPPs are typically calculated in three steps: first at the product level by averaging relative prices, then by obtaining unweighted PPPs, and finally at the aggregate level, with the weighted average of the PPPs of product groups. The weighting used in the final step is based on the expenditures associated with each product group. This method is used when a robust comparison between two economies is required.
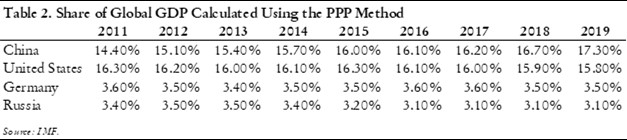
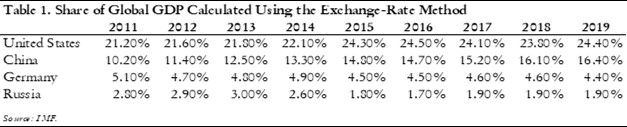
If we look at the United States, Germany, China, and Russia on the basis of exchange rate (table 1) and PPP (table 2) comparisons, several conclusions jump out. First, it is clear that the exchange rate method significantly underestimates the size of the Chinese and Russian economies. Using the exchange rate method, the size of the Russian economy is half that of Germany’s and around 130 percent of Spain’s. China, while growing more rapidly, is around two-thirds of the U.S. economy in 2019. With the PPP method, however, the profile of the Russian and Chinese economies changes drastically. The Russian economy almost becomes the equal of the German economy, while the Chinese economy reaches parity with the U.S. economy in 2016 and has since taken a slight lead.
The discrepancy between the exchange rate method and the purchasing power parity method is rarely taken into account in the literature for the general public when it comes to China and Russia. This may have led to undue optimism about the effectiveness of sanctions. But even the PPP measure may not yet reflect the real importance of the Russian and Chinese economies when strategic, geopolitical issues are at stake.
The Importance of the Productive Sector
When calculated from the point of view of production, GDP is typically broken down into different sectors: agriculture (including forestry and fishing), industry, construction, and services. Strong growth in the service economy has been the trend in the last fifty years across Western countries; service sectors have grown more rapidly than goods production and form an increasing share of Western economies. The “productive” nature of some services is certainly debatable. For example, some studies have sought to include the “services” of drug trafficking and prostitution into the computation of GDP.7 The question of the real contribution of some services arises even if the development of the service economy in peacetime is perfectly legitimate. But the reasoning changes in times of war or quasi war. During wartime, services lose their importance relative to agriculture, industry, and construction. It then becomes necessary to calculate the share of the goods-producing sectors across different economies in order to have an accurate understanding of how they really compare.

At first glance, we notice that Russia is situated between China, where services represent only 49 percent of GDP, and countries like the United States, France, or Italy, where services represent at least 75 percent of GDP. Germany is in an intermediate position, with 69 percent of its GDP coming from services. Russia’s position can be explained by the size of its industrial and agricultural sectors—a makeup that affects its real weight, as illustrated by table 4.

Tables 4 and 5 indicate that Russia and China’s GDP are significantly larger when we consider only directly productive activities. China’s economy becomes nine times stronger than Germany’s and three times as strong as that of the United States. The Russian economy also ends up outranking the German economy and clocks in at more than twice as strong as the French economy. This completely changes our vision of these economies—far from the claims that Russia ranks at the same level as Spain or that China still lags far behind the United States.
Innovation Indicators
But comparing West and East on industrial productivity metrics also has its shortcomings. It does not take into account innovation, which can be measured, however imperfectly, by the number of patents filed each year, or by the cutting-edge technology content of the goods produced. If we focus on patents—an indicator which may be biased by the fact that the development of a patent and its exploitation do not necessarily take place in the country of filing, and that patents may reflect financial exploitation of intellectual property rather than genuine innovation—we obtain the following list for the leading countries.8
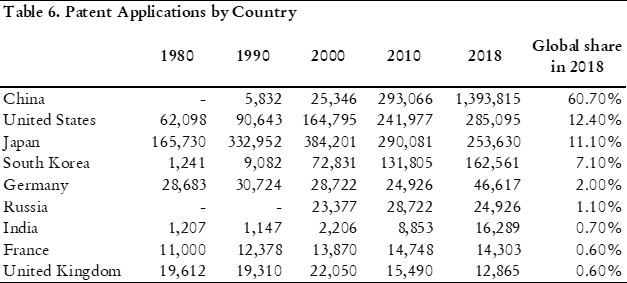
With this indicator, China still comes out on top by a wide margin, but Russia falls back to sixth position. More broadly, the combined number of patents from China and Russia is almost double that of the United States, Japan, South Korea, Germany, France, and the UK combined, giving us an idea of the balance of power on this front.
Global Exports of Critical Products
The final method for assessing the scale of the Russian economy is to measure Russia’s place in global exports of key products. In 2019, Russia was the world’s second-largest producer of platinum, cobalt, and vanadium, the third-largest producer of gold and nickel, the fourth-largest producer of silver and phosphates, the fifth-largest producer of iron ore, and the sixth-largest producer of uranium and lead.9 The main product of Russian agriculture is cereals; Russia is the world’s largest exporter of wheat10 and the largest producer of barley, buckwheat, oats, and rye, as well as the second-largest producer of sunflower seeds. Of course, Russia is the world’s largest exporter of gas (and has the world’s largest reserves) and the second-largest exporter of crude oil. This gives Russia, beyond its industrial capacities, a central position in the raw materials trade, a position that explains its alliance with China. Any interruption or sharp reduction in trade with Russia is likely to cause major disruptions in commodity markets.
It is now obvious why the attempt to represent the economies of China and Russia solely through GDP, using the exchange rate method, results in a misleading image of the economic power of these two countries—and a picture that can harm decision-making. The industrial production elements we have highlighted are all the more important in the current situation. Although we have not entered a wartime economy per se, outside of Ukraine, economies around the world are now heavily inflected by geostrategic realities. The use of several economic indicators—and the systematic search for indicators closest to reality—should be a priority if we want to seriously assess the balance of economic power and make decisions accordingly.
This article originally appeared in American Affairs Volume VI, Number 4 (Winter 2022): 81–86.
Notes
1 Simon Kuznets, “Modern Economic Growth: Findings and Reflections,”
American Economic Review, 63, no. 3 (June 1973): 247–58.
2 J. E. Stiglitz, A. Sen, and J. P. Fitoussi, eds., Rapport de la Commission sur la mesure des performances économiques et du progrès social, Vie Publique, September 15, 2009.
3 Heiner Flassbeck, H. Massimiliano La Marca, eds., Coping with Globalized Finance: Recent Challenges and Long-Term Perspectives (Geneva: unctad, 2007); Lucio Sarno and Mark P. Taylor, The Microstructure of the Foreign Exchange Market: A Selective Survey of the Literature, Princeton Studies in International Economics no. 89 (Princeton: Princeton University, May 2001).
4 Jacob A. Frankel and Harry G. Johnson, eds., The Economics of Exchange Rates: Selected Studies (London: Routledge, 1978).
5 P. Schreyer and F. Koechlin, Parités de pouvoir d’achat: Mesure et utilisations, Cahiers statistiques no. 3 (Paris: OCDE, 2002); Bela Balassa, “The Purchasing-Power Parity Doctrine: A Reappraisal,” Journal of Political Economy 72, no. 6 (December 1964): 584–96.
6 R. Dornbush, “Purchasing Power Parity,” NBER working paper no. 1591, 1985.
7 Sarah O’Connor, “Drugs and Prostitution Add £10bn to UK Economy,” Financial Times, May 29, 2014.
8 “Classement des États du monde par nombre de dépôts de brevets,” Atlasocio.com, June 23, 2020.
9 “Platinum-Group Metals,” U.S. Geological Survey, accessed October 19, 2022.
10 Anatoly Medetski and Megan Durisin, “Russia’s Dominance of the Wheat World Keeps Growing,” Bloomberg, September 23, 2020.
